Q4 MARKET UPDATE
Stay informed about freight market conditions and other factors that can impact your supply chain. In this Market Update, we cover the following: Truckload, Less-Than-Truckload, Intermodal, and International (Ocean & Air).
THIS ARTICLE COVERS
- Surprising trends on rejection levels
- Continued forecasting for capacity issues
- Parcel trends from 2021
MARKET UPDATE OVERVIEW
Capacity issues stemming from the ongoing Coronavirus (COVID-19) pandemic will follow the industry into 2022. While the service sector is starting to normalize, driver and truck shortages as well as capacity vs demand continue to be a concern. In the following Q4 market update, we will address the current market and help to assist you with planning for the future.
TRUCKLOAD UPDATE
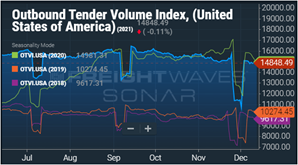
As seen in the graph below, volume levels remained extremely high in comparison to 2018 and 2019. Activity at all major ports as well as domestic production remains high and industry experts do not anticipate a decrease in manufacturing levels until the second half of 2022.


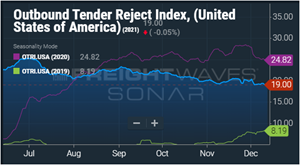
Although Q4 volume and rejection levels were down from 2020, the national dollar per mile averages were roughly 20% higher in Q4 than they were in 2020 across all modes of Over the Road shipments. This increase in national dollar per mile rates paid to carriers is a clear indicator that the driver, tractor, and trailer shortages will continue to be a challenge.
Over the past three months, we have seen the average dollar per mile rates climb for all modes apart from open-deck shipments. This is not an unusual cycle to see within Q4. Dry Van carriers have continued to increase their rates due to capacity constraints in order to accommodate the surge in holiday retail demands.
As winter temperatures continue to drop, commodities that typically require Dry Van trailers must now begin to use Refrigerated trailers to protect from freezing. On the open-deck side, construction projects and home improvements typically decline during the colder months. As the volume for open-deck loads decreases, carriers are forced to provide more competitive pricing to be awarded freight.
LESS-THAN-TRUCKLOAD UPDATE
Similar to the Truckload market, you can anticipate Less-Than-Truckload capacity to continue to tighten into 2022. Lack of available equipment, peak season pressure, overflow from parcel, and truckload capacity challenges are all compounding the severity of the current supply vs demand imbalance.
Expect continued carrier price increases, ranging from 8-12% on average, as carriers look to combat the rising costs associated with the following:
- Driver and labor recruitment / retention
- Increased purchased transportation costs
- Increased insurance premiums
- Increased operational costs
We are seeing Less-Than-Truckload carriers be more selective regarding the freight they induct into their network, the customers they transact with and the rules of engagement. As a result, there is a heightened emphasis and need to increase door capacity at the carrier level to address the expected increase in freight volumes moving forward.
You can expect to see carriers:
- Limiting and restricting volume Less-Than-Truckload shipments as a means of conserving capacity to serve more customers
- Instituting customer driven and geographical embargos to alleviate existing network pressures and bottlenecks
- Enforcing rules regarding tariff items (some that were historically loose) to ensure adequate compensation for each shipment and services performed
- Right sizing the profitability (taking increases) on less desirable freight (i.e., excessive length) and on suboptimal operating business (little profit/no profit)
- Refusing freight that doesn’t align with the carrier’s plan for their network vision and stabilization (overlength freight, high claims products, locations causing prolonged detention time, etc.)
We are committed to keeping you informed of the ever-changing supply chain challenges and partnering with you to provide solutions regarding service, capacity, and pricing.
PARCEL UPDATE
2021 has been another record year for Parcel shipments. With UPS and FedEx taking the approach of quality over quantity, shippers are forced to rely on immerging regional carriers such as LSO (Lone Star Overnight) and LaserShip to transport the surplus freight. During Q4 peak, it was predicted that package delivery demand would exceed capacity by about five million pieces per day.
- After 8 years of 4.9% yearly increases, FedEx and UPS will increase Ground rates by 5.9%
- Minimum charges will increase by 7.6% compared to 6.4% last year
- Parcel volume will hit the pre-COVID 2026 projection as soon as 2022
- Projected growth of 35% plus year over year projected from 2021-2022
In response to capacity issues, the carriers have already announced the following:
- Large shippers will be charged additional peak season fees
- Limitation on the number of packages UPS and FedEx will pick up weekly
- UPS will hire 100,000 and FedEx will hire 90,000 new workers
- Additional peak season charges
INTERMODAL UPDATE
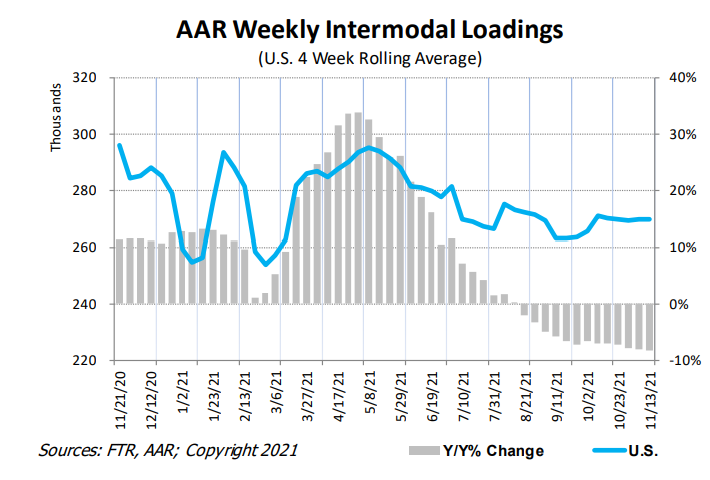
As we close out 2021, overall Intermodal demand has weakened roughly 10% year-over-year. This story is an interesting tale of two cities as the Domestic volumes have increased 6% sequentially, while International volumes have declined 13% year-over-year and are down 2% sequentially.
With ocean containers being at a premium and a strong focus on a port-to-port strategy by the ocean carriers, the Domestic growth is related to the increasing amount of port transloading from International to Domestic containers.

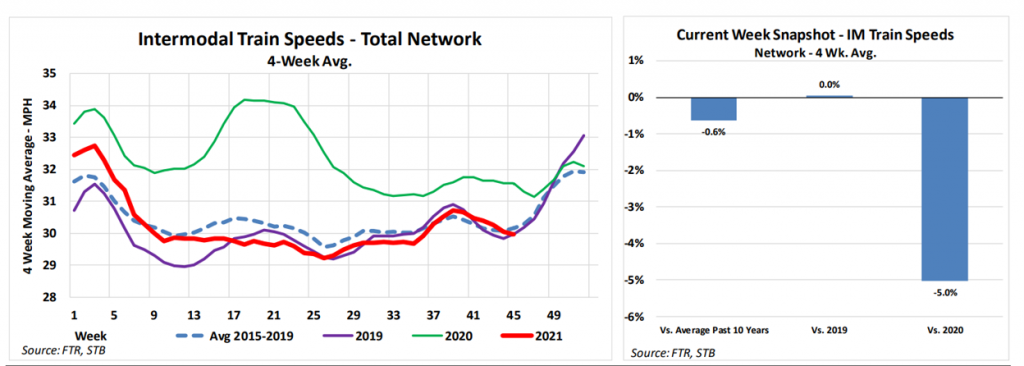
Over the past quarter Intermodal volumes have been relatively flat with rail carriers responding to specific lane and facility service challenges. Daily intermodal volumes have consistently increased as carriers work through congestion-related service issues. Service consistency continues to be a challenge and is a direct cost-driver of assessorial expenses.

While the current level of service is less than desirable, discussions with the railroad service providers are encouraging and point to efforts being made to streamline network operations that will, in turn, lead to a higher level of service consistency in the future.
As carriers continue to work through lane and facility congestion challenges, we expect Q1 through Q2 2022 to show a marked service improvement. Container utilization (defined as trips per month), chassis availability, and drayage capacity are always critical to consistent customer service. Key areas where we will be actively working with you:
- Drayage capacity limitations – managing with flexibility and planning
- Domestic 53ft chassis street time reduction is required to increase container trips per month – turn all asset types as quickly as possible
- Winter weather – will lead to additional service variability
Import volumes, either as IPI or Domestic transloads, on both the East Coast and West Coast will continue through Q2 2022.
On the Domestic product, rail services have been market-focused with the intention of maximizing network velocity, specifically car and container turn-times. Certain metro areas have had volumes metered inbound to avoid rail ramp congestion gridlock as chassis and parking constraints reached critical points. Drayage demand for the Chicago metro area is shown below and has been on a gradual decline as have moved through Q4 2021.

On the International product, many US ports continue to experience near record levels of imported containers. In a similar fashion, inland international terminals continue to struggle with congestion issues and slower than anticipated container deliveries to end customers, exceeding parking and chassis capabilities. Drayage demand for the Los Angeles metro area is shown below and has been gradually increasing throughout much of Q4 and has only recently begun trending downward toward expected seasonal levels.

We continue to see upward pressure on rates from all intermodal providers in the form of both linehaul, drayage and accessorial increases. Accessorial costs associated with terminal storage and equipment usage will continue to increase with the intent of driving higher utilization levels for chassis, container, and terminal parking. Surge pricing instituted in Q2 remains in effect. Our expectation is that these charges will remain in place through year-end.
Looking forward into early 2022, shippers should prepare for sustained regional pressure on drayage, container, and chassis availability due to higher-than-normal import and domestic volumes through Q2 2022. This demand will likely be driven by:
- Just-in-time shipping: Retail and Manufacturing segments struggling to improve inventory to sales ratios
- Just-in-case shipping: Several segments building inventory well beyond demand to address future inbound supply chain variability
- Existing order backlog reductions from manufacturers (specifically automotive, white-goods, consumer electronics) moving to end customer and inventory restocking
The continuing levels of strong International and Domestic demand will present service challenges, but with planning and dialog, service issues can be minimized. Together, with all the service providers in the Intermodal supply chain committed to increasing velocity and levels of service, the Intermodal product will make the continuous improvements required to support long-term volume growth.
INTERNATIONAL: OCEAN & AIR UPDATE
As the global container market was being to ease, following the holiday peak season, demand is beginning to pick up again as ocean carriers are indicating an increase in booking volumes under “premium” rates.
Vessel congestion in the ports of Los Angeles and Long Beach continues to rise despite the port’s implementation of a new queuing process.
The new process has helped to reduce the number of vessels in San Pedro Bay, however, the total number of vessels awaiting port continues to exceed 100. The average vessel wait time from anchor to port berth in Los Angeles is still increasing and hit an all-time high of 18 days. The congestion of backlogged vessels results in an inability to maintain regularly scheduled rotations.
On the east coast, the number of vessels awaiting berth in the port of Savannah has decreased from 23 to 18, yet Charleston is seeing an increase as more carriers bypass the port of Savannah and go directly to the port of Charleston.
Carriers agree that these missed sailings (known as “blank sailings”) will continue to result in capacity reduction in the range of 100,000 TEU to 150,000 TEU per week, which represents up to 25% of total capacity deployed in the Trans-Pacific trade.
Production activity in China increased during the second half of November and is expected to continue into 2022. Vietnam has shown modest gains at nearly 70% capacity.
Supplier and manufacturing output improvements could decline in the upcoming months if there is an outbreak of the most recent COVID-19 variant. In contrast, demand remains strong as larger U.S. retailers and their suppliers are respectively sitting on anywhere from 10,000 to 25,000 FEU (Forty-foot Equivalent Unit) containers of order backlog.
With increased demand prior to Chinese New Year in February, expect to see FAK (Freight All Kinds) and Premium rate levels increase as carriers once again struggle to handling demand in an environment of chronic capacity shortages.
IN CONCLUSION
As we conclude 2021, capacity constraints will continue to be a driving factor through Q1 of 2022. We recognize you have unique challenges, and to help meet your capacity needs, we have access to innovative technology, the latest market insights, and a flexible approach to help you maximize your business goals. We remain committed to supporting your operations as we potentially face another year of unprecedented supply vs demand.
For more detailed information regarding MODE Global’s view on the transportation market, please reach out to [email protected].
ABOUT MODE GLOBAL
With over 200 offices throughout North America, we solve a vast array of domestic, international, air, and ocean transportation challenges. Our shipping expertise encompasses small parcels, LTL, truckload, intermodal, air, ocean, and supply chain solutions to ensure every need is met.
